legacy-wiki
Gnuplot
Recovered from the older tannerjc.net wiki snapshot dated January 23, 2016.
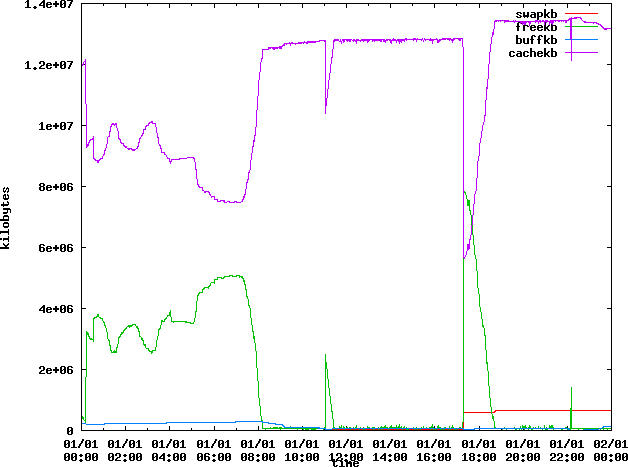
After cleaning up vmstat output using Text processing for use in gnuplot we can create some graphs.
This script creates an image for each data file, for which we have a data file for every day.
#!/bin/bash
for i in $(seq 16 27)
do
echo set term png crop
set xdata time
set timefmt '%H:%M:%S'
set xlabel 'time'
set ylabel 'kilobytes'
set output 'vmstat-2010-08-$i.png'
plot 'vmstat-2010-08-$i-sed.txt' using 1:4 with lines title 'swapkb', 'vmstat-2010-08-$i-sed.txt' using 1:5 with lines title 'freekb', 'vmstat-2010-08-$i-sed.txt' using 1:6 with lines title 'buffkb', 'vmstat-2010-08-$i-sed.txt' using 1:7 with lines title 'cachekb'
 | gnuplot
done;
- vmstat-2010-08-21.png**
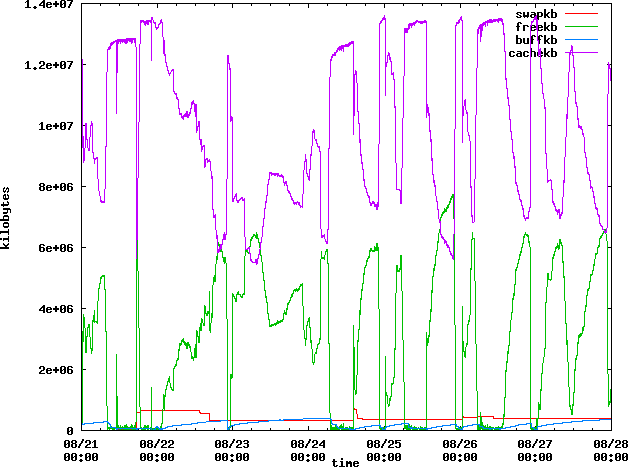
Going back to the original file I cleaned it up but this time I kept the full date, and didn’t separate each day into a separate file. Though I did grep out the first several days of data because they were before anything interesting happened. I modified the timefmt in gnuplot to utilize this new data file:
#!/bin/bash
echo set term png crop
set xdata time
set timefmt '%H:%M:%S %Y-%m-%d'
set xlabel 'time'
set ylabel 'kilobytes'
set output 'vmstat-2010-08-21-27.png'
plot 'vmstat-21-27-clean.txt' using 1:5 with lines title 'swapkb', 'vmstat-21-27-clean.txt' using 1:6 with lines title 'freekb', 'vmstat-21-27-clean.txt' using 1:7 with lines title 'buffkb', using 1:8 with lines title 'cachekb'
 | gnuplot
- vmstat-2010-08-21-27.png**
Plotting pure vmstat output
If you have vmstat data in normal format with no time stamps here is how you can plot all the memory information from it.
Assuming your vmstat output looks like this:
procs -----------memory---------- ---swap-- -----io---- --system-- -----cpu------
 r  b   swpd   free   buff  cache   si   so    bi    bo   in   cs us sy id wa st
 5  1 341964 6576452 421952 5986780    0    0    91    67    3    3  2  1 97  1  0
 1  0 341964 6580032 421980 5989152    0    0   244   352 1357 5199  2  1 96  2  0
 0  1 341964 6576196 421996 5989580    0    0   216   192 1247 4943  3  1 96  1  0
The following gnuplot commands should work:
$ gnuplot

	G N U P L O T
	Version 4.2 patchlevel 6
	last modified Sep 2009
	System: Linux 2.6.32-66.el6.x86_64

	Copyright (C) 1986 - 1993, 1998, 2004, 2007 - 2009
	Thomas Williams, Colin Kelley and many others

	Type `help` to access the on-line reference manual.
	The gnuplot FAQ is available from http://www.gnuplot.info/faq/

	Send bug reports and suggestions to http://sourceforge.net/projects/gnuplot

Terminal type set to 'x11'
gnuplot set term png crop
Terminal type set to 'png'
Could not find/open font when opening font arial, using internal non-scalable font
Options are 'crop medium '
gnuplot set output 'vm.out.png'
gnuplot plot 'vm.out' using 3 with lines title 'swpd', 'vm.out' using 4 with lines title 'free', 'vm.out' using 5 with lines title 'buff', 'vm.out' using 6 with lines title 'cache'
- vm.out.png**
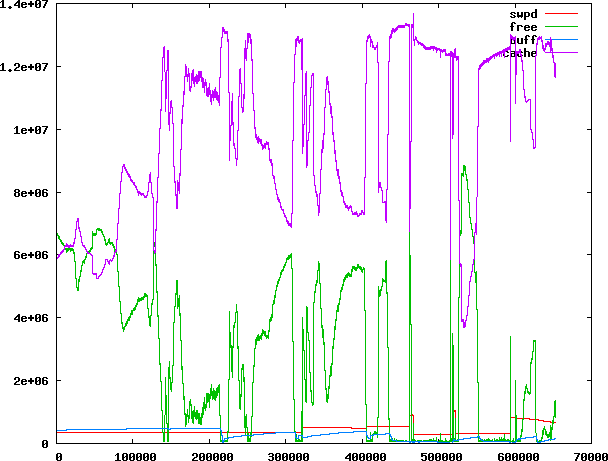
The numbers on the x axis are line numbers. If you wan’t you can not set the output to png file and let it use X11 to display, then you can use right mouse button to hilight a region and zoom in on the region with left click.